I recently came across a little known function that’s really useful for debugging.
The console.* functions have always been a great tool. They output data to the Chrome Debugger console. They can be used for tracing, timing and other statistics.
However, they’re a bit clumsy for looking at structures.
For example, suppose you have a structure like this:
languages = [ _
    { name: "JavaScript", fileExtension: ".js" }, _
    { name: "TypeScript", fileExtension: ".ts" },_
    { name: "CoffeeScript", fileExtension: ".coffee" }_
]
If you execute console.log(languages), you’ll get a tree structured view of the data which you can expand.
But if you do console.table(languages), you’ll get this:
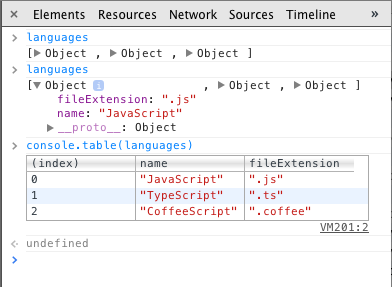
Pretty cool!